Your True Exercise Thresholds
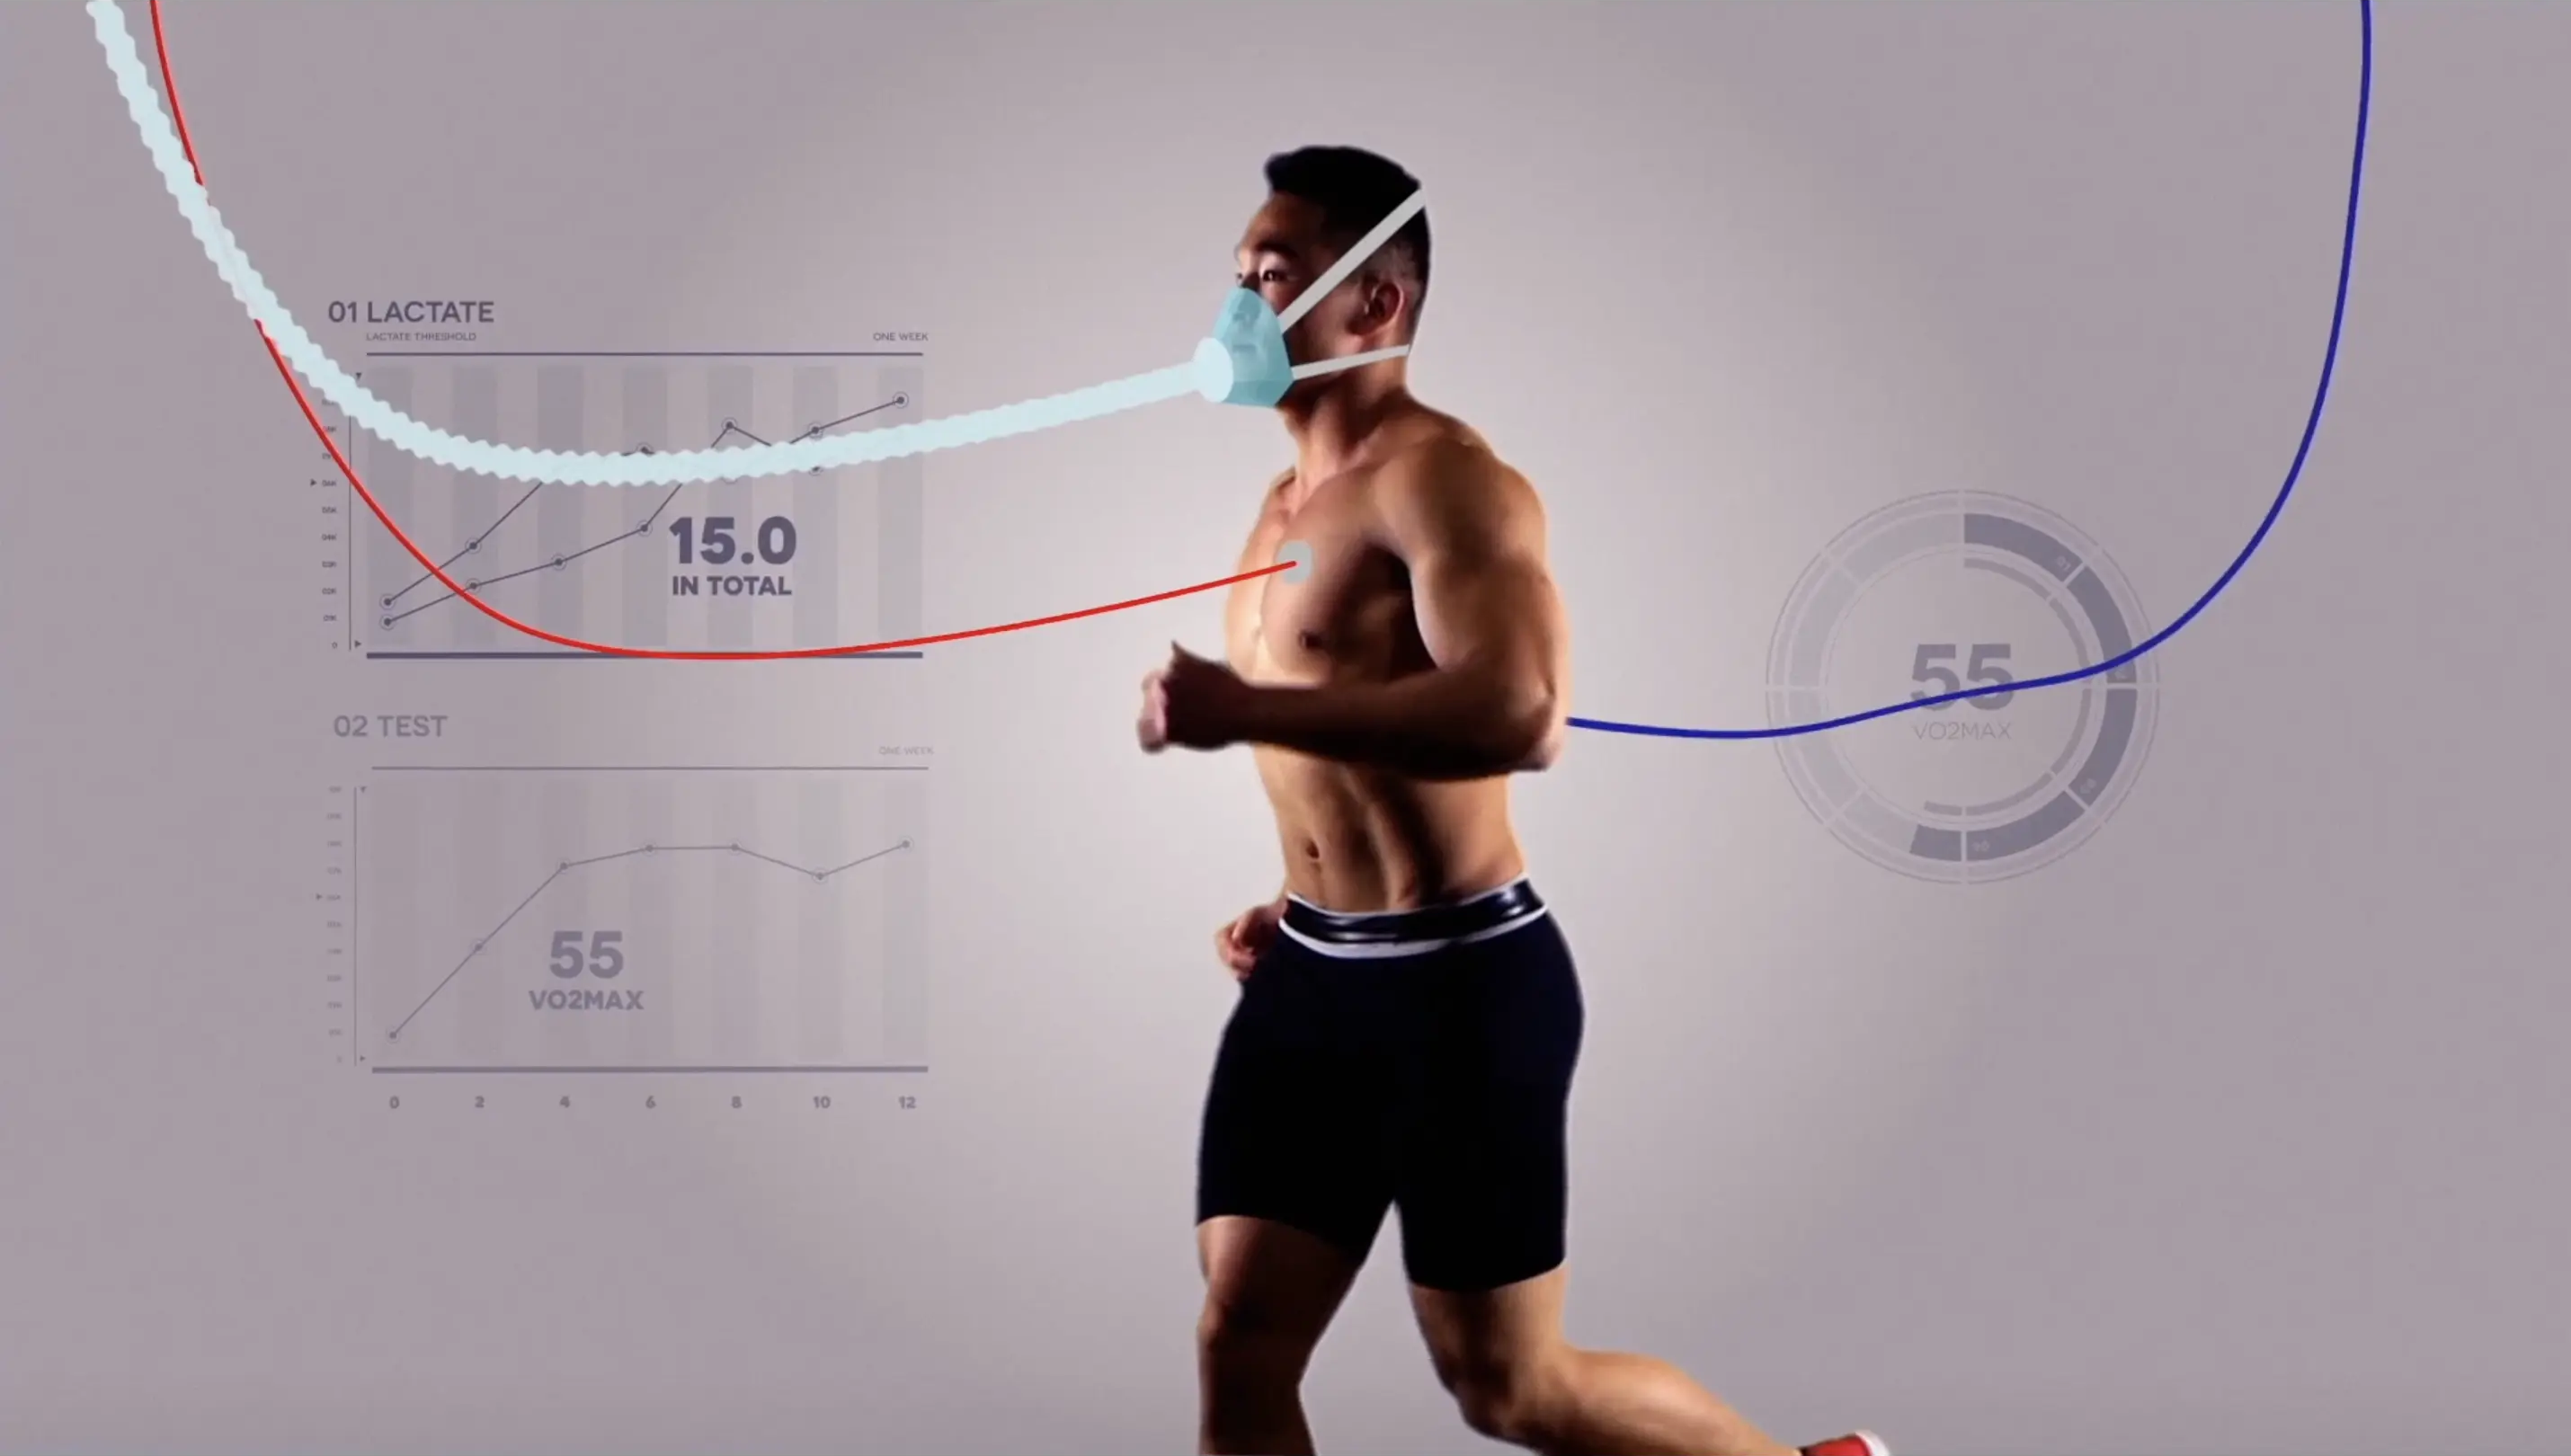
Exercise thresholds have been defined as boundaries between different domains of exercise intensity. They are used by medical professionals to clinically assess patient physiological function or dysfunction, such as heart failure, diabetes, peripheral artery disease, and suitability for surgery or transplant. They are also used to predict athletic performance or assess the ageing-related decline in cardiorespiratory fitness (Poole et al. 2021).
However, the threshold concept has been clouded by controversy for more than 50 years. This long-standing controversy has lead to extreme confusion in the definition, measurement, interpretation, and nomenclature of exercise thresholds. Hoping not to add to the confusion, please bear with us for a short overview.
How to take a straightforward idea and make it hopelessly complex.
We are borrowing this header from the above cited review because it is straight to the point. Traditionally, the most investigated thresholds have been defined by blood lactate levels during exercise. The identification of these thresholds requires the analysis of blood samples taken during a maximum effort laboratory test of stepwise increasing intensity, usually on a treadmill or bicycle ergometer.
 Testing for thresholds in the lab.
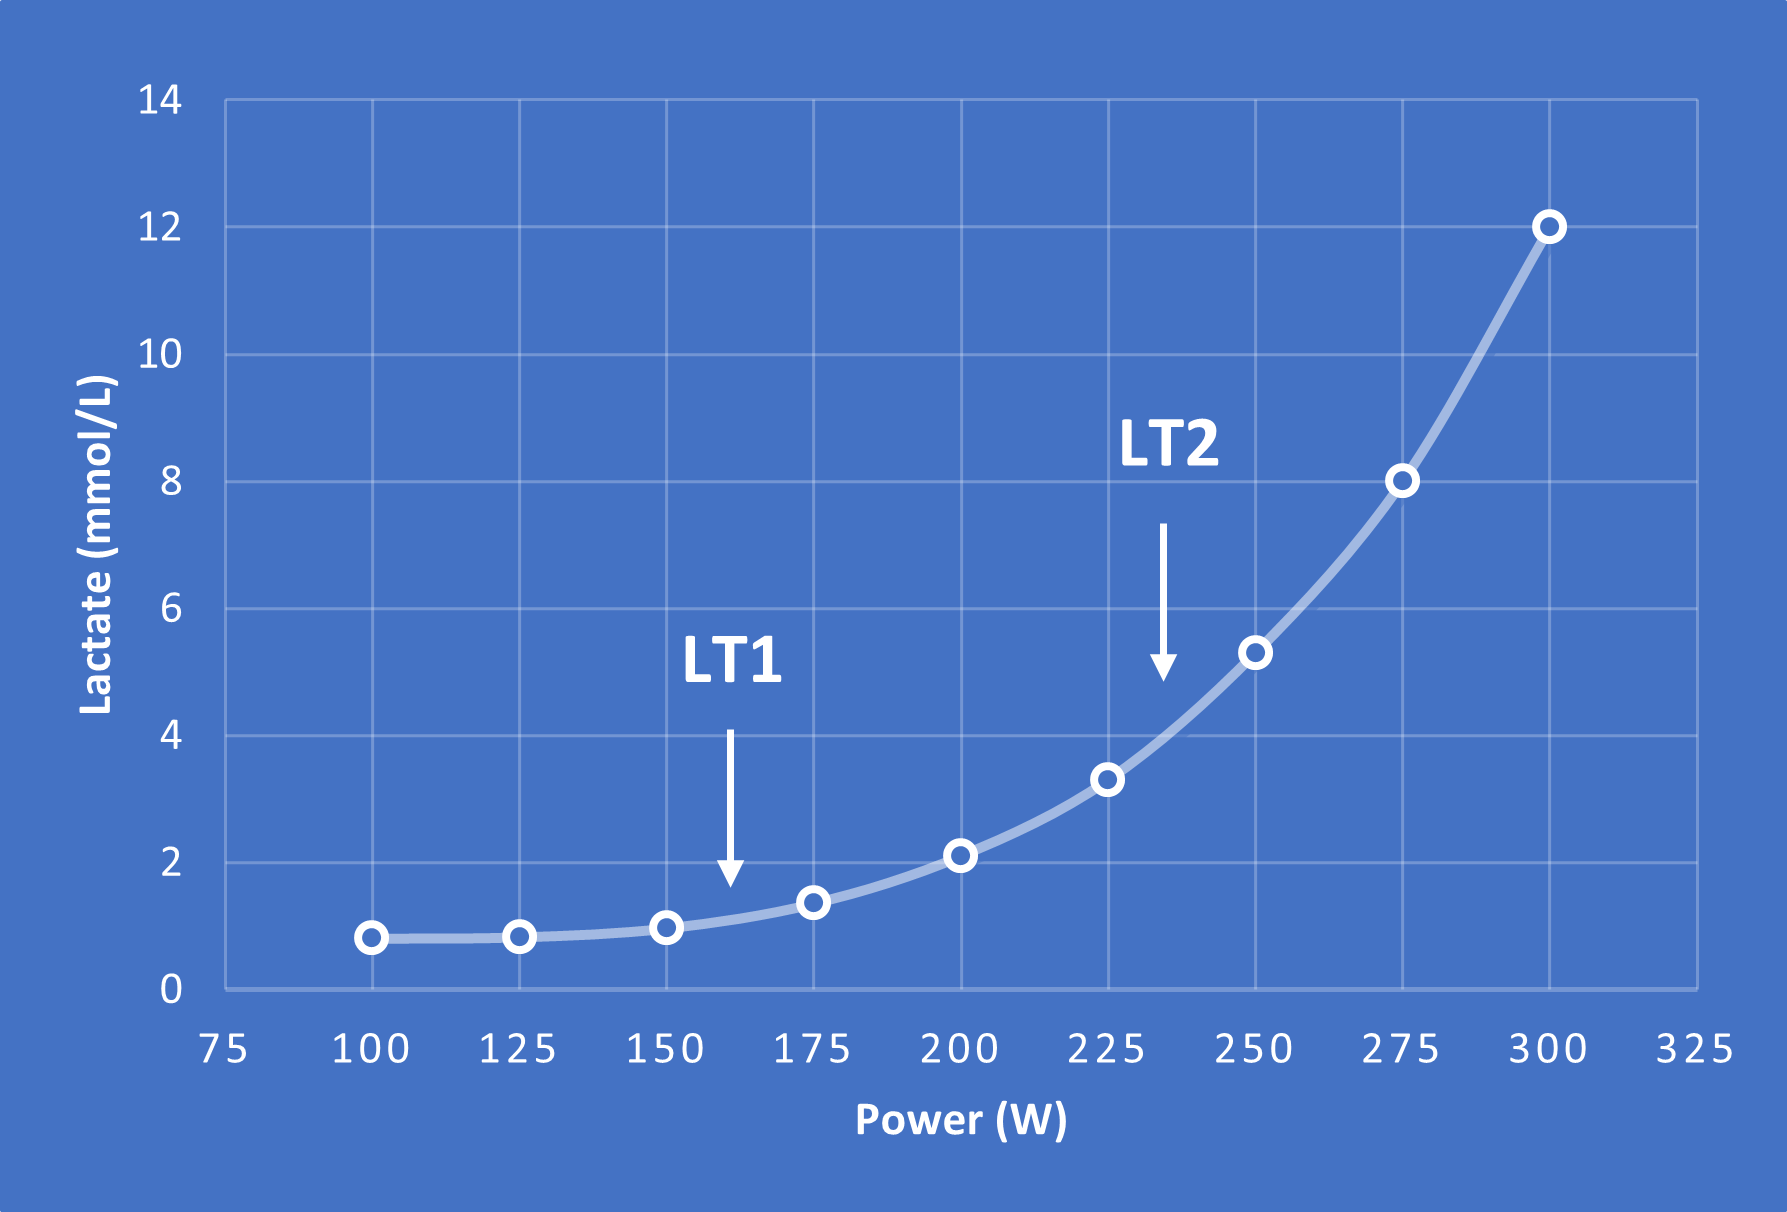
Deflections or breaks in the lactate/power curve have been interpreted as lactate thresholds (LT) and in a 2009 review (Faude et al. 2009) more than 25 different measures of LT were identified. The identification of the thresholds is usually done visually from the graph and is thus subject to considerable error.
However, as shown on the graph below, two lactate thresholds have received the most attention, the first one being the intensity where blood lactate starts accumulating (LT1) and the other one where blood lactate starts to accumulate exponentially (LT2). The LT2 threshold has also been named MLSS, OBLA, AT, AT2, RCT, IAT, fatigue threshold and lactate turnpoint, leading to ever increasing confusion and controversy.
 The infamous lactate curve.
An exercise threshold can also be identified from gas exchange measurements of inspired oxygen (VO2) and expired carbon dioxide (VCO2) during a submaximal laboratory test, using the so-called V-slope method. This threshold is known as the gas exchange threshold (GET) or ventilatory anaerobic threshold (VAT) or simply as the anaerobic threshold (AT), and usually coincides nicely with the previously mentioned LT1 threshold. The LT1 was originally named anaerobic threshold (AT) but according to the Poole et al. review (2021), the term ’anaerobic threshold’ should be discarded for other than historical purposes.
Cyclists have their own threshold.
Cyclists have developed a cycling-specific exercise threshold, called functional threshold power (FTP), usually measured as the average power output during a 60-minute all-out cycling trial. This was originally designed as a rough estimate of the LT2 threshold intensity, since many riders were seen to be able to ride for about 60 minutes at LT2 intensity. However, numerous studies and user stories have since shown that the LT2 duration is very variable between riders, ranging from about 30 minutes for beginners to over 2 hours for elite riders. For the beginners, the FTP is therefore lower than LT2 and vice-versa for the elite riders, for whom the FTP is higher than the LT2 power.
 Cyclist racing at FTP threshold pace.
The critical power threshold.
By now we already have different detection methods and multiple definitions of seemingly only two exercise thresholds. But the confusion does not end here. More recently, a third exercise threshold has been introduced, the so-called critical threshold (CT), more often referred to as critical power (CP).
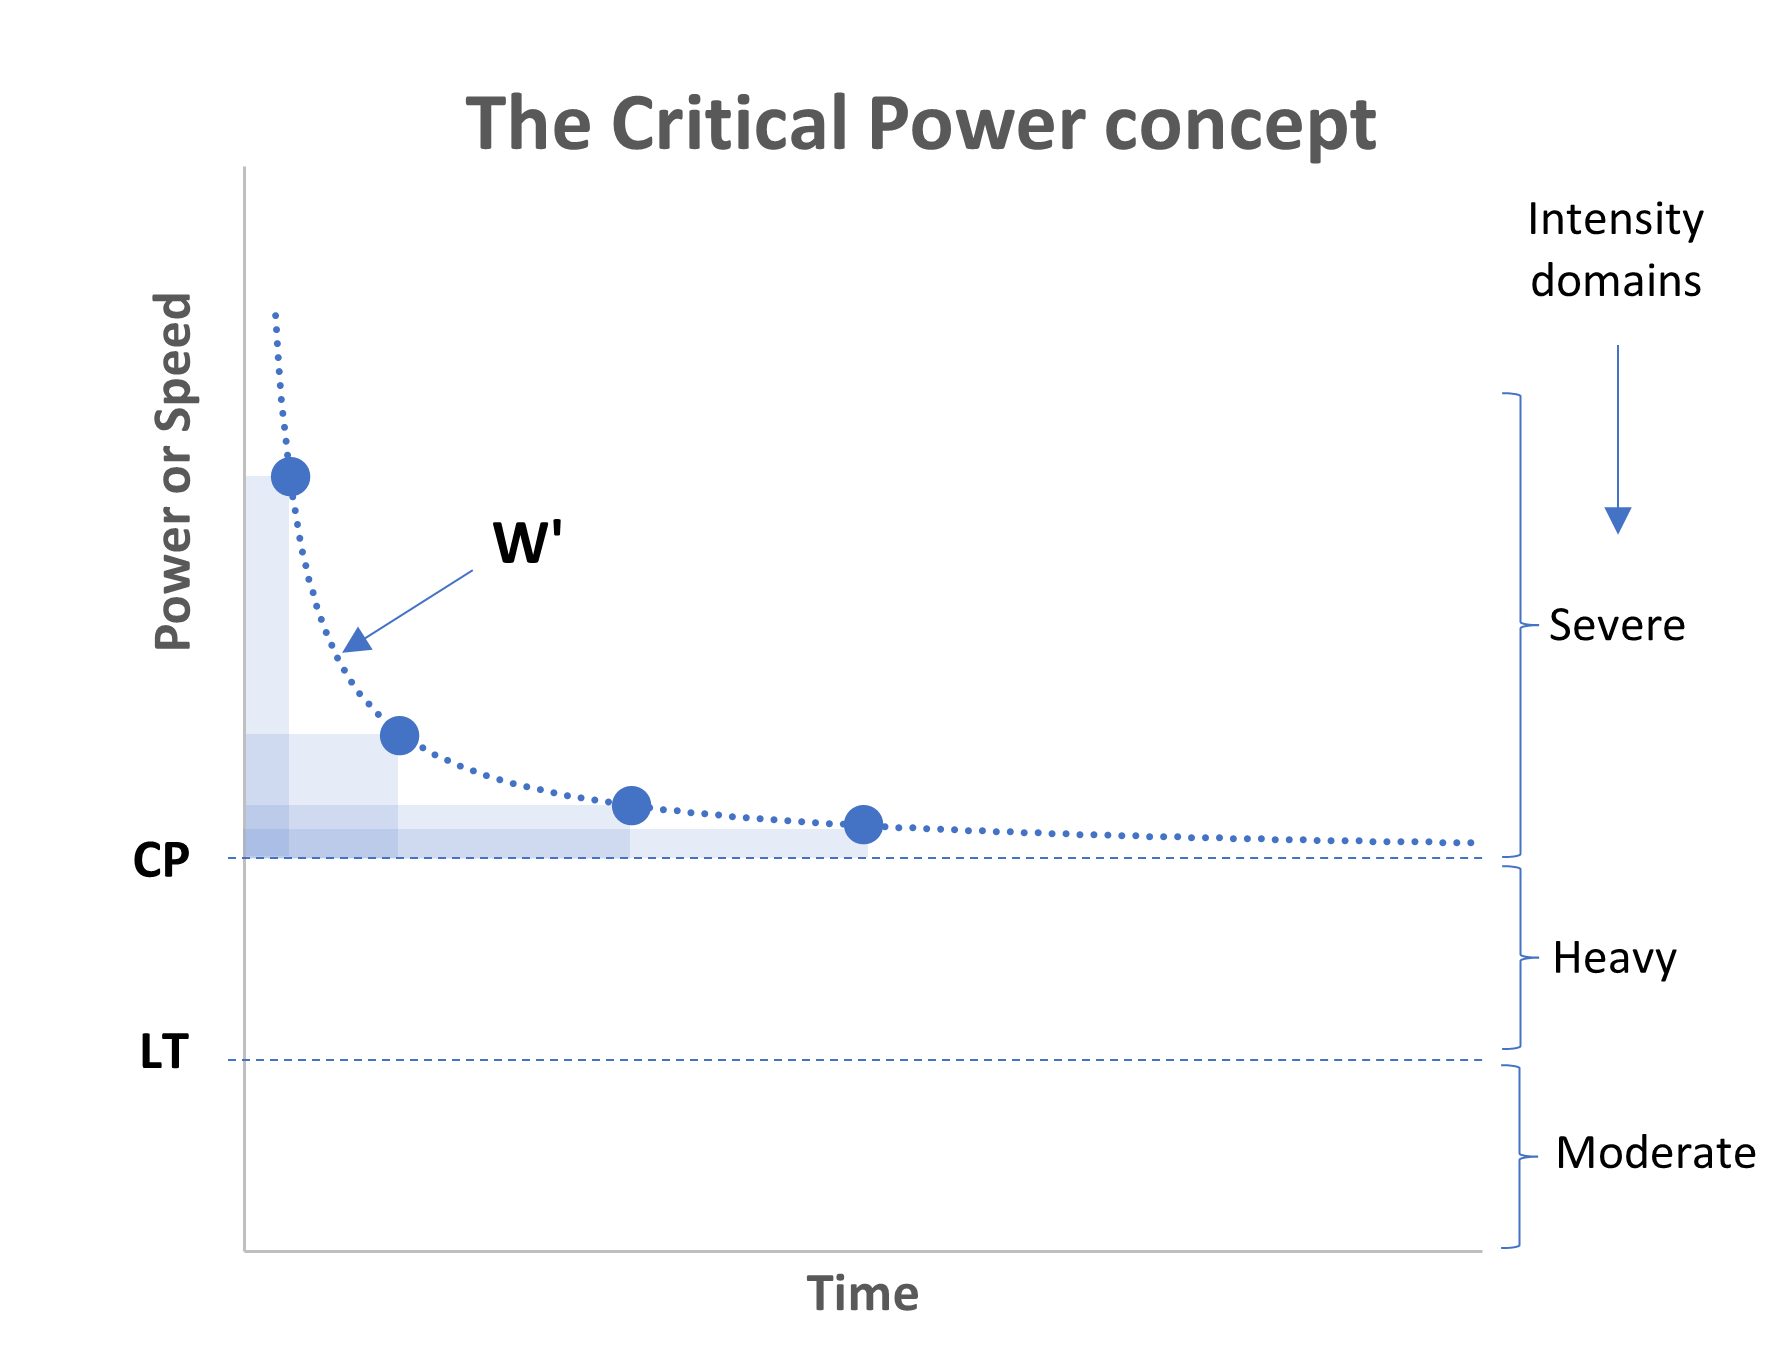
The critical power threshold (CP) is based on the maximum average power or speed that can be maintained over different time durations. In the case of running, the identification of CP therefore requires an analysis of average speed that can be maintained over widely different distances by the same runner within a comparable time frame. The average speed is then plotted against duration (time), as shown on the graph below.
 The traditional critical power graph, with thresholds and intensity domains.
The hyperbolic curve on the CP graph gradually approaches a linear asymptote (dashed line) called critical speed (CS) or critical power (CP). Theoretically, the runner should be able to run indefinitely (forever!) on this speed, while in practice most runners would collapse from exhaustion after only 30-60 minutes. This „minor“ issue does, however, not discourage some scientists against adopting the concept in its current form. The CP threshold is typically placed slightly above the LT2 threshold and well above the LT1/GET threshold, previously described. These thresholds mark transitions between the moderate, heavy, and severe intensity domains, as shown on the graph. The curvature zone above the CP line is defined as the anaerobic work capacity (W').
The alleged small difference between LT2 and CP raises the suspicion that they may in fact be the very same threshold. The discrepancy may be easily explained by an obvious tendency to over-estimate CP, while under-estimating LT2 in ramp-incremental lab tests (Poole at al. 2021, Galán-Rioja et al. 2020).
The exercise threshold system.
So, there you have it! The seemingly endless controversy over two ill-defined exercise thresholds. However, the history of science has told us that there is usually order in chaos.
Driftline is introducing the Exercise Threshold System (ETS):
Driftline's innovative ETS system is based on a scientific theory that may finally bring order to the threshold chaos! The ETS theory shows how exercise thresholds reflect transitions in muscle fiber recruitment, and reveals a range of new, previously un-detected thresholds.
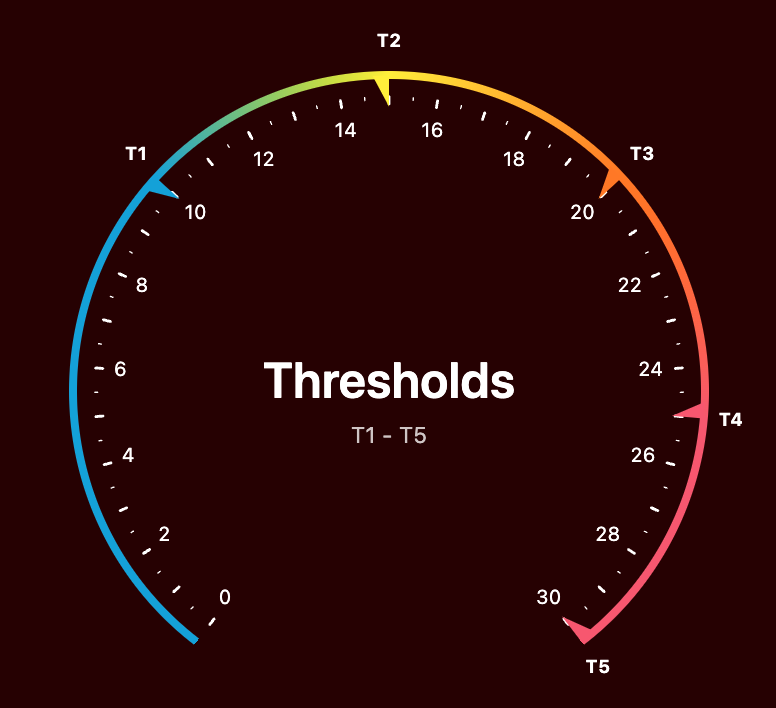
Human muscle consists of three major types of muscle fibers, i.e., slow oxidative fibers (SO), fast oxidative/glycolytic fibers (FOG) and fast glycolytic fibers (FG). With increasing exercise intensity, the working muscles recruit progressively faster fibers and transitions in fiber recruitment are reflected in five evenly spaced exercise thresholds. In the context of running, we choose to refer to them as speed thresholds. The ETS system can be figuratively explained with a familiar speedometer, as shown below.
 Driftline's exercise threshold system explained on a speedometer with five speed thresholds.
The speedometer shows the five evenly spaced speed thresholds (T1 – T5), with the T5 threshold fixed as the maximum speed. The base of the speedometer represents zero speed, while the top represents the maximum speed. Intuitively, there are also five speed zones (Z1 – Z5) between the respective speed thresholds. The performance capacity of the muscle is determined by the size and typology of the muscle and remarkably, the alignment of thresholds relates directly to actual power or speed.
Opting not to add to the existing threshold confusion, for now we are naming only three of the thresholds! T1 is named Endurance threshold since it reflects the ratio of slow, aerobic muscle fibers and determines the individual’s aerobic endurance. T2 is named Critical threshold since it is critical for endurance performance and coincides with this familiar scientific threshold. Finally, T5 is named Max speed threshold since it represents the individual’s absolute maximum speed.
Yes, intuitively maximum speed equals your highest speed threshold!
The missing link of exercise physiology.
Having discovered the innovative Exercise Threshold System, there is no room for undue modesty. In our next blog you will learn how Driftline discovered the missing link of exercise physiology:
Driftline’s breakthrough discovery of Endurance!
